Energy Consumption by Facebook - My First #MakeoverMonday Challenge
Zen Master Andy Kriebel's #MakeoverMonday Challenge is quite popular in Tableau community. He shares a dataset every Monday and enthusiasts around the world quickly create dataviz and share on Tableau Public. I love the concept. It's rapid-fire collaboration and wonderful mode to exchange ideas.
It's been 22 weeks Andy has been doing this and I hadn't attempted it before however, last week something hit me and since I have been looking forward to today.
About Week 22 Challenge
This week's #MakeoverMonday challenge is about carbon footprints of Facebook. From this details report, Andy collected a small dataset and shared with us. Dataset has three columns [year], [energy source] and [contribution to energy consumption]
The most important key takeaway from the Facebook report is that Facebook is committed to environment sustainability and it is sourcing more and more green energy to reduce it's carbon footprints and to source 50% of its energy requirements from clean and renewable energy sources and to ultimately move to 100% green energy to power its data centers and all other requirements.
It's a noble vision by Mark and we have got the data, so let's upload it in Tableau and tell a story
My First #MakeoverMonday Challenge
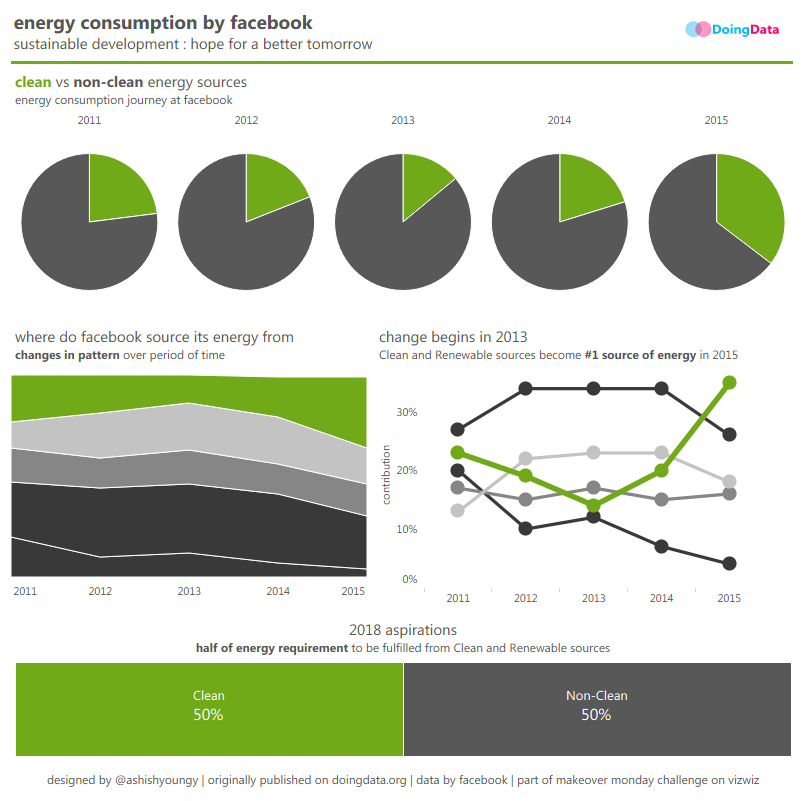
And this is what I ended up making
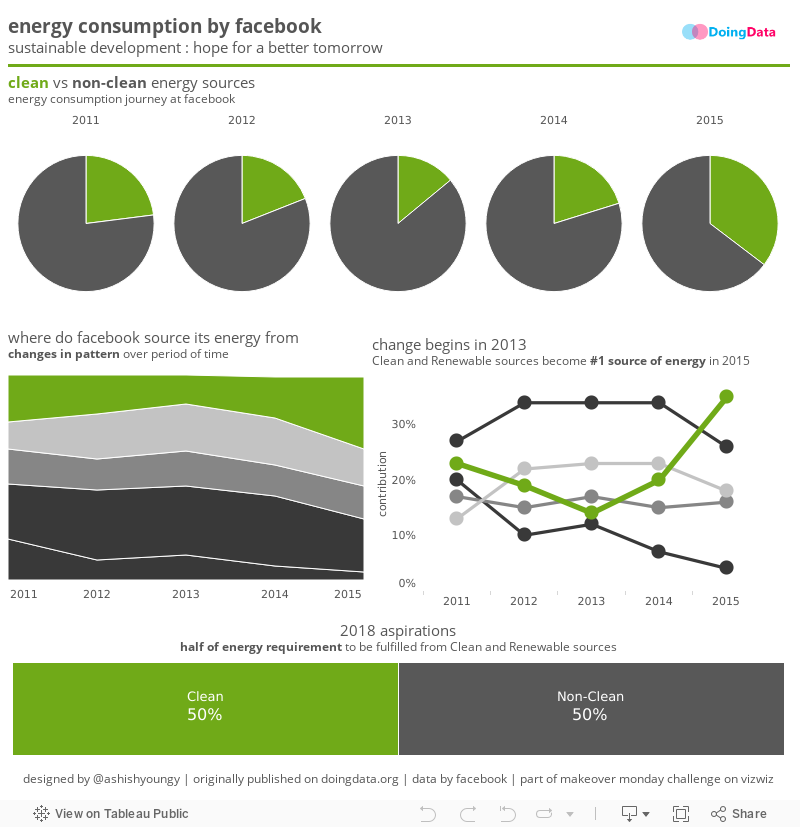
The Story
- In 2011-12, the energy sourcing from clean and renewable sources plummeted from 23% to 14%
- And the contribution of energy from clean and renewable sources has become 2.5x from what it used to be in 2013
- Currently clean and renewable energy is the #1 source of energy supply at Facebook
- And looks like a beautiful upward trend for last two years
- And Facebook is optimistic to fulfill half of its energy needs from clean and renewable sources by 2018
Definitely looks like a better tomorrow! Happy DataViz. And I loved to pursue my first #MondayMakeover challenge. I heart it.
Acknowledgments
I extend this post to say thanks to Andy Kriebel and Andy Cotgreave for managing and driving #MakeoverMonday, Tableau to offer a powerful platform like Tableau Public for free, and to Pooja Gandhi for influencing me (my phone beeps every morning to her tweets).